See the Same Students’ Progress of Learning
Challenge: The signals were mixed about math progress in Morgan Hill. The district believed the NWEA MAP assessments provided the best evidence of student progress. Based on that assessment, math progress looked good. But the CAASPP (also known as SBAC) assessment was the evidence of record in California’s accountability system. And that evidence, interpreted by the Dashboard’s rules, showed math to be in the trouble zone (orange in the numbers-free lexicon of California’s Dept. of Education). But Morgan Hill’s math results were almost identical to the statewide average math results on the CAASPP/SBAC. So how should the conflict between NWEA results and CAASPP/SBAC results be interpreted?
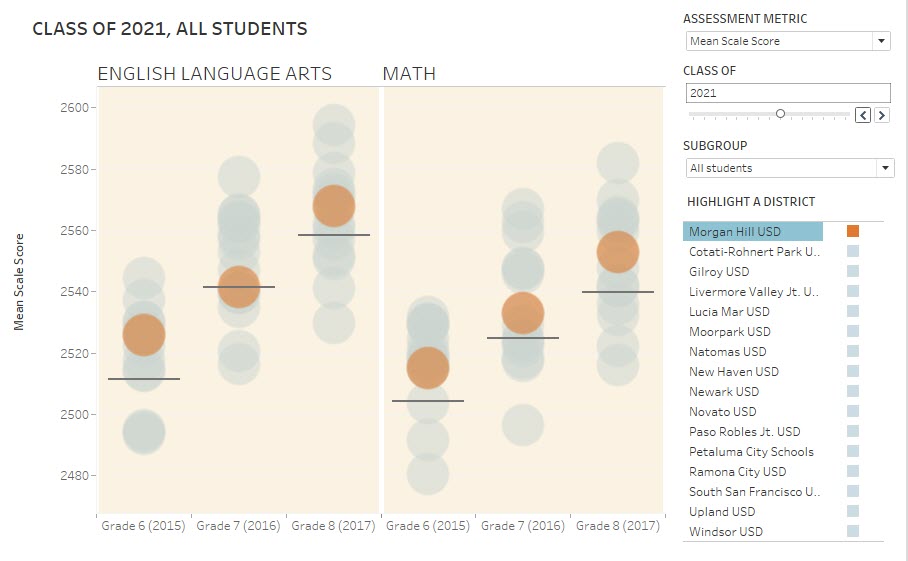
Solution: Define progress as the increase in mastery estimated by test results (both CAASPP/SBAC and NWEA), but for the same students over periods of time that were 3 or 4 years long. Create visual expressions of progress using both similar districts’ results and statewide results as a benchmark.
What we did: Our K12 Measures analytics team took the CAASPP/SBAC results and viewed them from a new angle: quasi-longitudinal analysis of cohorts of students over several years’ time. We visualized the results for four graduating class cohorts, showing either three or four years of results for a fairly stable group of students. Then we framed their results within a context of 15 districts whose students most closely resembled their own, controlling for student attributes as much as possible.
What they did: The district leadership team, led by their Director of Curriculum, Instruction and Assessment, analyzed the results. They turned to our K12 Measures team for our opinion. Then they reviewed these results with principals, and after discussing them, shared it at community meetings and board meetings. This visualization ended up in their LCAP.
Outcome: In the end, after switching from snapshot views of cross-sectional results to quasi-longitudinal views of progress, the results from these two tests were fairly consistent. Here’s what the district leader, Glen Webb (Director of Curriculum, Instruction and Assessment) had to say: “SWP has been a true partner … by working hand-in-hand with us to develop meaningful local metrics and data visualizations to assist in communicating with our stakeholders.” Click here to read the letter in full.
Time required: 4 hours
Client: Morgan Hill USD