California’s CAASPP test results were released statewide on October 18. All over the state, many of the 4,500-plus school board trustees are sitting down with their trusted sources at their side, trying to make sense of it all. Some will rely on reporters’ interpretations. Others will ask their superintendent for guidance. Fewer still will request a board study session. Isn’t this an opportunity?
No education leader should be sitting back waiting for the next board meeting to discover what their trustees have concluded these results mean. This moment is the ideal moment to offer guidance to your trustees, and share your own interpretation of the numbers.
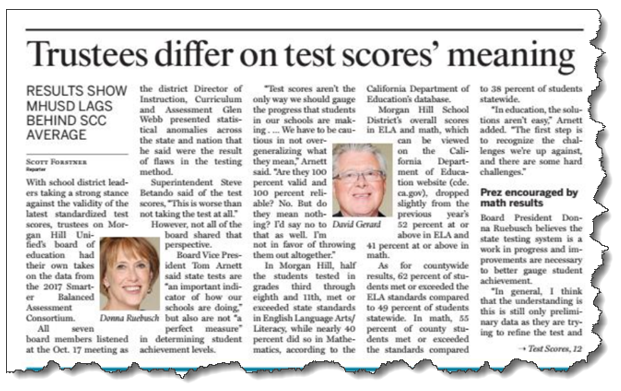 Contrary to popular opinion, the numbers do not speak for themselves. The results are not self-evident. The numbers are just raw material that people use to build evidence in their heads. The mortar they use to connect those bricks of evidence is logic. People see the numbers from a somewhat different angles. Everyone’s sense of logic differs. What you should expect is what this newspaper headline states: differing interpretations of the scores’ meaning.
Why misunderstandings of test scores are likely in California
In the not-so-golden state of California, the California Department of Education (CDE) has contributed mainly illogic to the interpretation of test results since fielding its Dashboard. The Dashboard puts a barrier in the way of those who are interpreting test results. The Dashboard added “noise” to the “signal” and then told everyone to use it for LCAPs, SPSAs, determining the fate of charter schools when their renewal petitions are reviewed. This “noise” only makes misperceptions and incorrect inferences more likely.
What the CDE has done is torture the test results, squeezing them into colored boxes, ignoring the screams of pain as the data pleads, “Please look at my imprecision and uncertainty,” and “Please use scale scores” and “Growth of learning requires measuring the same kids over time.” (You can find my essays that critique the Dashboard in depth, one flaw at a time, from this link.)
How to make better use of CAASPP results
If you want to make sense of the CAASPP results for your board, I urge you to put together a board study session,* keep the Dashboard far from the table, and reorganize the CAASPP results along these lines:
- Measure the same kids over time. Look at graduating class cohorts’ results over time (the longer, the better). This enables you to distill an estimate of the rate at which students learned, rather than the level at which they scored. Looking at changes over three, four or five test cycles helps you avoid the odd annual events, and helps you see the bigger forces at work.
- Compare to highly similar districts. Find a few districts whose students are as similar to your own students as possible, based on the factors you do not control: parent education, the degree of English fluency of students, and the rate at which they qualify for subsidized meals. By creating a small set of similar districts, you control as much as possible for student variability. That leaves you with a clearer estimate of the effect of your schools on your students.
- Use scale scores. Look at a metric that describes the result of all your students in the grade levels tested. That would be the average scale score. The seemingly simpler “percent of students meeting or exceeding standard” is, in fact, just a description of a portion of your students – those who crossed a line.
- Look at the spread or distribution of students across the scale score spectrum. But averages also conceal critical info. A measure of spread is a frequency distribution. It is captured in a statistic called the standard deviation, but it’s better to see it. The evidence in visual form should lead to a great discussion of how many kids are behind and ahead of grade level, and by how much.
Exercise the “local control” you’ve got
The freedom you have as a district leader is limited, of course, but it is bigger than you may think in ways you can influence your board. You are an educator, after all. A board study session is an opportunity to educate, persuade, and build shared understanding and bonds of trust.
I’ve had the experience of meeting board members who were ready, willing and able to make sense of test results. Their work required numeric fluency: nurses, architects, carpenters, scientists, military analysts. Perhaps you’re lucky enough to have one in your midst.
If not, ask for help. It beats getting behind the wheel with one eye shut and a broken dashboard in front of you.
* My crew, the K12 Measures team of School Wise Press, just completed a board study session for just this purpose. To learn more about it, send me an email: steve.rees@schoolwisepress.com