I returned a few weeks ago from the California Charter School Association conference, where I was among 3,000 educators brave enough to lead 1,200 charter schools in the not-so-golden state. I admire their courage in facing the Alice-in-Wonderland rules of the California Department of Education’s (CDE). Those rules, plus the deeply flawed Dashboard, make it more likely that charter authorizers may allow very weak schools to be renewed, while closing very strong ones.
 However, the good news is that charter leaders and their authorizers, like Alice at the Mad Hatter’s Tea Party, may choose to follow a more logical course. They can simply agree to rely on other measures which they consider to be more sound, and push the Dashboard aside. May rational judgment prevail. Join me at the Mad Hatter’s Tea Party. Let’s go to the CDE’s building at 1430 “N” Street, Sacramento, where the Mad Hatter, the White Rabbit and the Dormouse are serving six errors with tea and biscuits, each teacup sitting on a cracked saucer that resembles a Dashboard dial.
Error #1: Joining two things together that have no relation to each other: status and change.
This error is pervasive. The entire 5×5 matrix joins the status of something to its change of level from the prior year. What moved them to do this? Change from one year to another year in schoolwide test scores, discipline or graduation rates, has a limited meaning on its own. Change over three or more years would be more meaningful. The level alone can be meaningful if interpreted wisely. But joined together, they are meaningless.
Investment analysts look at changes in prices of stocks, bonds, mutual funds, etc. And they look at change over time, as well as trading volume, and comparison to relevant benchmarks. But they certainly never put the price together with the change from prior day, and create a third data point. Montana cowboys have a joke about this. “What do you get when you mate an antelope and a jack rabbit?” A jack-a-lope. And what’s it good for? Not a dang thing.
Error #2: Failing to compare the same kids over time when measuring year-to-year change.
Why would you compare different kids and think you’re measuring year-to-year change? A middle school with grades 6, 7 and 8 is about one-third different each year. Sixth-grade kids come and eighth-grade kids go. So in any given year, one-third of the kids aren’t the same. California, like other states, took buckets of federal funds to build a student longitudinal data system. Why wouldn’t the CDE people use it to look at student results longitudinally?
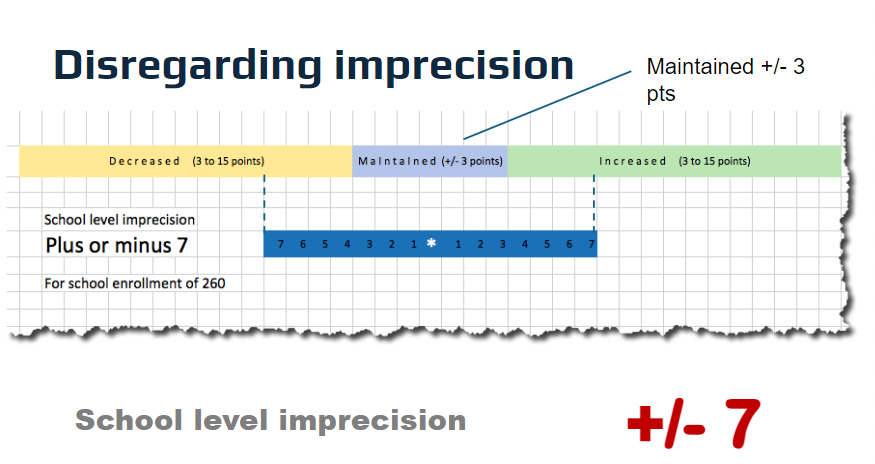
Error #3: Failing to account for imprecision and uncertainty when measuring test results.
The inherent, inescapable fact is that test results are imprecise. They are estimates of student mastery and knowledge. The CAASPP results for a school testing between 240-260 students can be +/-7 to +/-9 scale score points, depending on the students’ grade levels and the number of questions they answer. That means that about two-thirds of the time, that school full of kids will attain an average scale score that is +/-7 to +/-9 points from their reported average score. Now look at the 5×5 matrix and its middle three bands. (See figure below.) The middle of five is the “maintained” band. Its value is +/-3 points. If you draw the average score with its imprecision range +/- 7 scale score points to the left and right of it, a school with 260 kids tested is going to span three bands of the five-band matrix. This renders year-to-year change useless information.
Error #4: Failing to look at growth over more than two school years.
Measuring schoolwide change in scale scores from one year to another is itself a mistake. It fails to take account of the same students’ changes from their baseline scores. But in addition, compounding that mistake is using a one-year interval of change. Certainly even one year of real growth is not meaningful enough to base a decision about a charter renewal upon. Go longer to get meaningful results. The longer the better.
Error #5: Failing to regard how long a student has been enrolled in the school.
If a student transfers into your middle school in 8th grade, after having had three straight years of weak math instruction, why should your school “own” the responsibility for that student’s 8th grade math scores in full? If she’s been enrolled for one year out of three, shouldn’t that student’s score be discounted when used as a measure of school’s effect on her learning? It is, after all, the effect of the school on students that the Dashboard is seeking to measure.
Error #6: Failing to account for ceiling effect and floor effect.
If you’re leading a school whose kids’ test scores or grad rates are already quite high, they can’t go much higher. So they’re more likely to decline than rise. Hence, the term “ceiling effect.” And if your school serves kids whose test scores or grad rates are already very low, they are more likely to rise than fall. That’s the “floor effect.” In addition, there’s a statistical phenomenon called the tendency to “regress to the mean” (or average). This means that a cohort that has a super-strong year in math in 4th grade will be very likely to see their scale scores fall (or “regress”) back toward the state average scale score in 5th grade. In brief, this means that years of big gains will be “punished” on the Dashboard which will note only the decline of students’ scores from the prior year.
Summary
Any one flaw would cause technical staff with any pride to blow the whistle. Any two flaws, especially flaws that have a compound effect, would lead responsible leaders to issue a press release and retraction. But six? In baseball, the rule is “three strikes and you’re out.” In the game of charter renewals and school accountability, I think six strikes is sufficient to earn the CDE’s Dashboard a double strike-out. Time for the CDE to retire their Dashboard, get themselves a new group of technical advisors and start over.
By the way, the chapter of Alice in Wonderland called “A Mad Tea-Party” ends with the Dormouse and the Hatter arguing about whether you can draw treacle from a treacle well. Alice leaves in a huff, and declares, “‘At any rate, I’ll never go there again!’ said Alice, as she picked her way through the wood. ‘It’s the stupidest tea-party I ever was at in all my life!'”
(You can see more evidence of many of the Dashboard’s six errors from slide #46 of this slide deck which I presented at the CCSA conference in Long Beach on March 20. You can find additional essays about the Dashboard’s broken dials on ED100, and in the blog section of my company’s website. You can also find an article I co-authored with David Osborne, published in EdSource, on a Dashboard caused near-death experience of Animo Ochoa Middle School in Los Angeles.)