Educators have standards for nearly everything. Why not data? Why not evidence? With so many people feeding so much data about so many education factors into so many computers, no wonder we are seeing evidence of vastly different quality across the K-12 landscape.
Certainly, not all evidence is of equal quality. Just as in cooking or construction or woodworking, both the raw materials (data) and the skill of those who build evidence vary in quality. I offer a simple summary that places results into four categories:
- The best evidence is built by skilled analysts from sound, high quality raw materials (data).
- Quality of evidence falls when it is built by lesser skilled analysts from sound data.
- Quality of evidence also slips when it is built by skilled analysts, but from flawed data.
- The most flawed evidence is built by unskilled analysts from data that are flawed (two problems’ combined effect).
Lawyers can’t win a case with evidence that doesn’t meet a standard of evidence. Consider one example. Our past president’s claims of election fraud lacked evidence that met a legal standard. So judges in state after state dismissed his allegations of fraud. This is an example of the fourth type: bad arguments, connecting make-believe “facts” with flawed logic.
THE DASHBOARD’S DEFORMED EVIDENCE
In California, nearly every advocacy group and charter management organization has built its own way of representing the raw material that is CAASPP results. The CDE’s answer to this has been to build its own method of interpreting CAASPP results (and more), and then declare it to be the sole authority. It is their Dashboard. Declaring it to be the “final word” in the interpretation of the meaning of test results, graduation rates and more does not make it so.

“Tower of Babel” by Pieter Breugel the Elder. It is interpreted as an example of pride punished, and that is no doubt what Bruegel intended his painting to illustrate (source: Wikipedia).
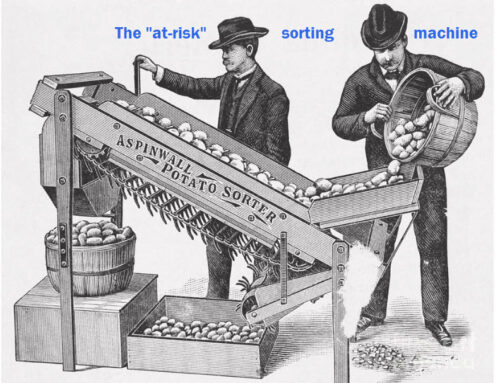
Its creators start with a sound assessment: CAASPP. But the Dashboard’s creators push test results through business rules that lack logical coherence. Joining test results to the change from prior year is a non-sequitur. It yields an Alice-in-Wonderland number that the Dashboard creators then assign to a color. To make matters worse, they reinterpret test results in light of participation rates. The result is a great deal of twisted evidence from which charter authorizers are being asked to make big decisions about a school’s right to continue operating. This leaves both charter operators and charter authorizers in the lurch. If you want to read about the flaws that generate that “noise,” you can read my April blog post on the six flaws baked into the Dashboard. If you want a fuller critique of each of those six flaws, take a look at my other blog posts on the Dashboard’s flaws here.
If the Dashboard’s findings were to land in a court of law, and rules of evidence applied, I doubt they would stand up. The rules of evidence are logical reasoning and the principles of statistical inference. I’d enjoy seeing the Dashboard held to these standards.
WHERE ARE THE CDE’S TECHNICAL EXPERTS?
Over a dozen years ago, the CDE enlisted the help of technical statisticians who advised them well. The Academic Performance Index was designed to measure just what it claimed. You might disagree with its premise. But you couldn’t fault its measures. It did what it said it would do. No noise. Just signal. It combined test results across all subjects tested to produce a weighted index.
The experts who designed it defended it successfully against its critics. One of them was a Stanford professor named David Rogosa. I watched him defend the API at a conference of the Education Writers Association, where a panel of journalists criticized the API on methodological grounds. Their attack got nowhere.
The CDE in those days also had division leaders like Bill Padia and Lynn Baugher who were plenty savvy, technically smart and politically attuned. They did not stretch the purpose of the API beyond its limits. That quality of leadership, and their sense of appropriate constraint, is missing from the CDE today.
BETTER EXPERTISE IS NEARBY
The CDE can correct its Dashboard’s errors and diminish its noise. It just needs to admit its mistakes and call social scientists whose core competence is precisely in this type of interpretive analysis. They might call Sean Reardon and his team at the Stanford Education Opportunity Project, or Andrew Ho at Harvard, or perhaps Thomas Dee, also at Stanford. They are economists and social scientists whose exceptional work has won praise from peers and policy leaders.
Since the leader of the State Board of Education, Linda Darling-Hammond, is also dean of Stanford’s Graduate School of Education, perhaps she can persuade them to lend a hand. Indeed, persuasion will be required, however, since the CDE sued Dee and Reardon in July 2023 for some silly nonsense. The CDE legal beagles soon retreated and dropped their suit. I hope they also apologized.
Whoever they ask, I hope they do so soon. Charter renewal petitions are back on the calendar. Schools’ and districts’ reputations are on the line. And Tony Thurmond is soon going to announce he’s running for governor. All could be damaged by the noise generated by the CDE’s Dashboard.


