I’m eager to share a story of our use of two different measures of emerging readers’ skills to gauge whether teachers are referring the right kids to Tier 2 reading support. But not before I blow off some steam. I’m just tired of hearing the mantra of “multiple measures.” It usually is chanted as an admonishment, at times with a wagging finger. “Just use multiple measures.” At times it’s offered as a reminder, as if we were still children who needed a parent to remind us to put our boots on before we went out in the rain. As if it were easy… as if multiple measures had magical powers. In the past 20 years of listening to educators talk about how to make sense of test scores, not once have I heard anyone suggest how exactly one should go about “using” multiple measures.
There. Now that I’ve ventilated, and feel better, I’m ready to share this story.
The question was put to our K12 Measures team by a client whose district was seeing signs that their way of teaching reading was not working for about 4 out of every 10 kids. Most of those students were being referred to Tier 2 for reading support. Untenable. It’s twice the maximum Tier 2 support should carry. It was certainly twice the workload that the reading specialists were prepared to shoulder. So the district, and its eight schools serving elementary students tried to do what they called triage, identifying the 15 percent of kids who needed help the most. (They also started a review of whether their way of teaching reading, using a Balanced Literacy curriculum from McGraw-Hill, “Wonders,” and Fountas & Pinnell’s levelled literacy program, was part of the problem.)
But triage is no way to run a reading program. It’s designed for emergencies, like earthquakes or fires, where a hospital is overwhelmed with patients. Triage is the process of deciding who can benefit from your help, and who is too far gone to be helped. In the medical world, it’s for the worst of moments. Hearing it in the school world was troubling. The term “triage” implies that some kids who need help just aren’t going to get it. In medicine, it implies that some patients are beyond help.
Our work, as analytic partners, included improving the quality of evidence used to detect signs of struggling readers as early as possible. But it also included noodling this additional riddle: “Are teachers referring the right kids to Tier 2 reading support?”
Our approach was to take the two assessments available at the earliest possible grade level (grade 2), and plot kids’ scores on both assessments at the same time. Scatterplots are the right visualization, of course. Then we would look to see, of those kids who scored the lowest on both assessments, how many were not assigned to Tier 2? Conversely, of those kids who scored the highest on both assessments, how many were assigned to Tier 2? Those two factors combined would represent our best estimate of likely errors (misidentified students).
Combining measures of uneven quality can improve identification of lagging readers
Our assumption was that the imprecision and uncertainty that were part of both assessments, and the natural variability of student test-taking would be minimized if we looked at the results of two assessments, focusing mainly on the zones of agreement. If both tests showed signs that a student was lagging or soaring, we’d be much more likely to be correct in making a summary judgment about that student’s reading skill. Does that mean we were likely to identify all kids who needed reading support but were not referred? No. Does that mean we were likely to identify all kid who didn’t need reading support, but were referred? No. But it does mean that we were able to be confident of our flagging misidentified students when both assessment results pointed in the one direction, and when teacher referrals pointed in the opposite direction.
Here’s why our approach was an incomplete answer to the key question. When one of the two assessments produced results that were not close to estimating a student’s true reading capability, but the other was right in the zone of the student’s true reading skill, we would omit that student from our analysis. How likely was that to occur? That depends on the quality of each assessment (and a lot of other potential sources of “noise”).
Improve the quality of test evidence: intersection of test results limits noise
The two tests were entirely different creatures. The NWEA MAP reading test is a multiple choice test that students take on a computer, that adapts the 45-55 questions it delivers to students based on their answers. This computer adaptive feature, combined with the lack of a time constraint, enables the student to get questions that are fit as tightly as possible to her level of mastery. The test is the core service of a testing firm, the Northwest Evaluation Association, whose investment in items, technology and norms built every five years is substantial. It has been the subject of many third-party studies, and is well correlated to the SBAC assessment. It’s solid.
The other test we used was the Fountas and Pinnell (F&P) assessment, which is part of a curricular package featuring levelled reading, published by Heinemann. The test was developed by reading experts, and is given by teachers to students one-on-one, with the teacher scoring students as they read passages and words. The teacher tallies student reading errors, and then asks some comprehension questions. The teacher is both proctor and score-keeper. There are no norms offered by the publisher, and I could find no third-party validation studies. It’s of questionable quality, and even worse, it contains a self-confirmation bias. The F&P test wants teachers to discover that the F&P instructional program works. The text that students read is accompanied by pictures. The reading strategies students are taught encourages students to use context clues to guess at a word if they can’t sound it out. This method, called three-cueing, is taught as a reading tactic, part of their Balanced Literacy approach. The test also incorporates pictures, which makes it easy for students to use visual cues to guess at words.
Yet teachers report this is the test of reading they favor. Its popularity is evident in how frequently the test is given. Of the 2,810 students who were first-graders over the last five years, 69 percent took this test in the fall, and 77 percent did so in the spring. Of those who were second-graders, 80 percent took it in the fall, and 88 percent took it again in the spring.
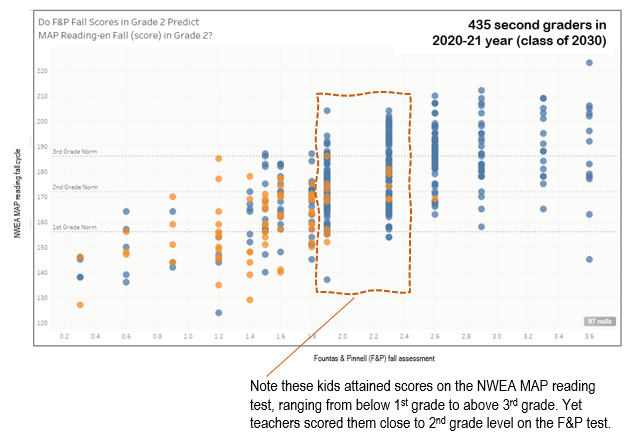
So when we looked at the NWEA MAP reading scores of second-graders who were given the F&P and scored very close to grade level, we saw many who scored at the third-grade equivalent scale score on the NWEA MAP reading and above. And we observed fewer score below the second-grade level, but enough below to conclude that teachers’ judgment of student capability using the F&P wasn’t helpful in predicting their scores on the NWEA MAP reading test – at least for those students who teachers believed to be at grade level. (Note: Blue dots indicate those students who have not been referred to Tier 2. Orange dots indicate students who have.)
But were the F&P scores of students well below grade level more likely to agree with those who also scored lower on the NWEA MAP reading? By and large, yes. This was a case of teacher judgment expressed on the F&P score agreeing with the NWEA MAP reading results for just those kids who were low-scoring. (See the left four columns of scores on the F&P above.)
Quality of human judgment can be improved with well built evidence
By looking at the results of two tests together, we can select the strong evidence about some students, even as we disregard the weaker evidence about other students.
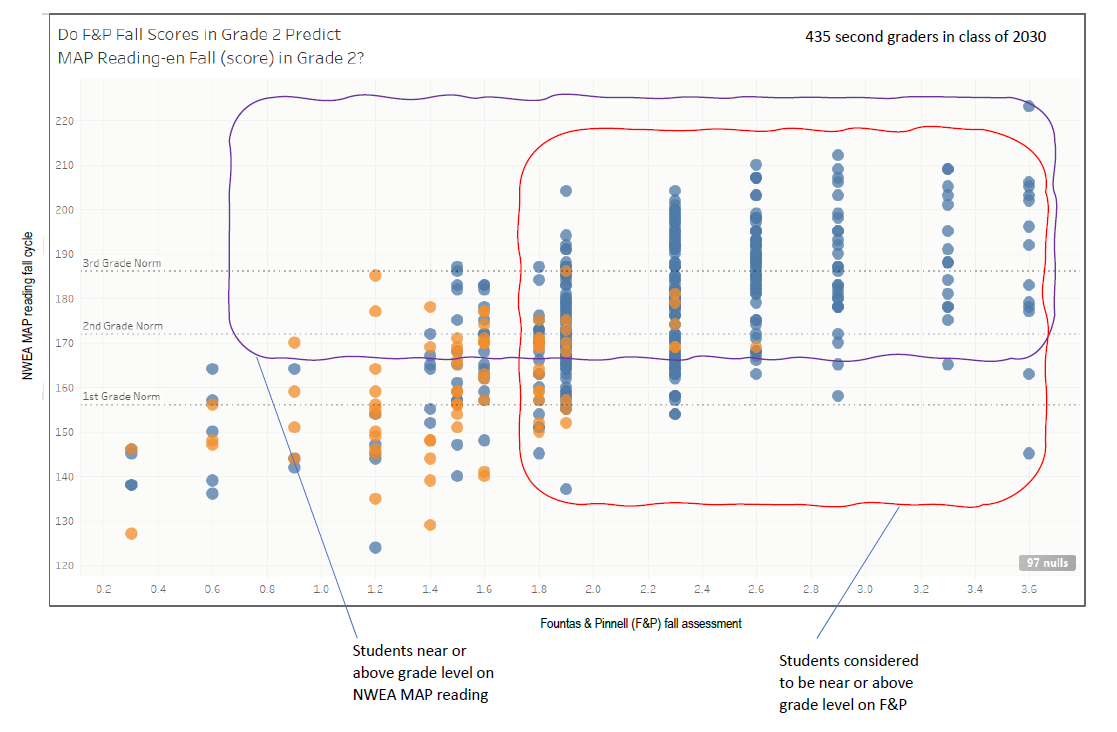
Take a look at the areas bounded by the wiggly lines. Each rectangle shows the range of students who scored near grade level or higher. Where those rectangles intersect, you can be more confident that the results of both tests point to actual student reading skill. Where the rectangles do not intersect, where only one test indicates students have scored at or above grade level, you have to accept being somewhat less confident that student mastery of reading is correctly estimated.
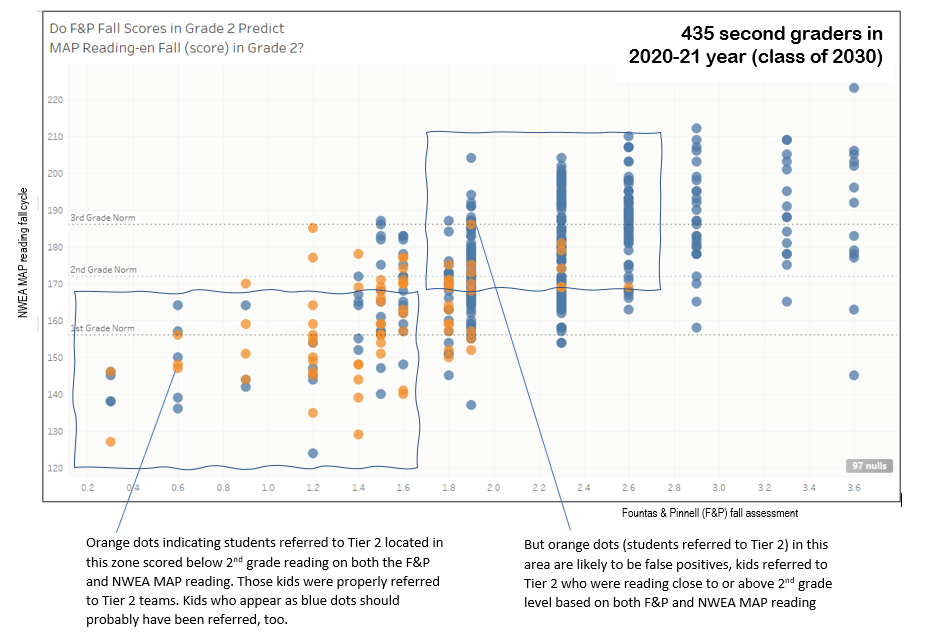
But here we have the areas marked in the lower left rectangle where both tests indicate that students are about half-a-grade-level lower than second-grade. Orange dots indicate a student who has been referred to Tier 2 for help. Blue dots indicate those students who have not been referred. Any blue dot in the left-most rectangle is likely to be a student who teachers missed – students who should have been referred but weren’t. In the rectangle to the right, orange dots indicate students who were referred, but most likely should not have been.
Evidence should lead to dialogue about teacher judgment
The point of juxtaposing evidence from two tests alongside teacher judgment is not to show that teachers were wrong, wrong, wrong. Perhaps teacher judgment was incorrect. But perhaps teachers knew something that the test evidence did not reveal. The point is to start the conversation with teachers, to ask them what evidence they used to make their referral decisions. It’s to discover which teachers’ referral decisions tended to agree with the evidence, and which teachers’ decisions more frequently clashed with the evidence. For principals who are managing teachers, wouldn’t this be a useful way to coach them?
Wouldn’t this have been more valuable and useful evidence to have on the table before Tier 2 referral decisions were made? As a “game tape,” a review of events already occurred, it can only serve to improve the judgment of teachers and change their behavior the next time they sit down to make Tier 2 referral decisions.
Instead of reaching for the cookbook of alleged “best practices” that are all too often just a basket of tradition-bound opinions, wouldn’t this approach to evaluating teachers’ professional judgment be a good way to talk about minimizing errors, reducing student misclassification rates?
Every profession that requires human judgment results in some degree of error. Isn’t it time we tried to make it visible? Isn’t that what John Hattie urged in Visible Learning? Let’s see if the K-12 analysts out there can compare notes, and band together to make teacher judgment visible, too, matched to the evidence that should support their judgment. Let’s make errors visible, so everyone can improve their game.