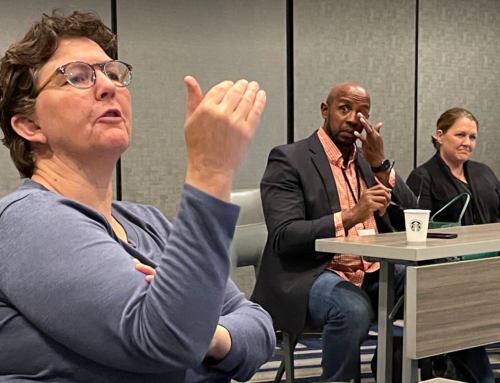
On June 8, 2018, I had the good luck to enjoy a conference at Teachers College, Columbia University, joining nearly 100 scholars, district leaders, business leaders and research people. All of us were drawn by an unusual topic: Education Leadership Data Analytics Summit.
The list of those who care about the low level of data literacy among K12 leaders is a long one. But among them are these sponsors of the event: National Science Foundation New England Big Data Hub and the Robertson Foundation. A problem this big has earned the attention of pillars of science and philanthropy. I consider that to be good news. The faculty team that put this together was headed by Alex J. Bowers, who is associate professor of ed leadership. (Alex and his talented colleague, Yilin Pan, are about to debut an online course for ed leaders, an intro to data analysis and research. More on that soon.)
The keynote speaker, Andrew Krumm of Digital Promise, came from Redwood City, California to talk about learning analytics. What educators can learn by harvesting students’ measures of effort and engagement is vast. Andrew’s stories were meaty and meaningful. No surprise. He is co-author of a new book, Learning Analytics Goes to School: A Collaborative Approach to Improving Education, that provides ample evidence of the benefits that await those who take the plunge.
Alex Kaplan, leader of IBM Watson’s Education group, offered a critique of dashboards, currently a fashionable delivery mechanism for visual information. When analytic intelligence is not designed into data displays, what’s the benefit in seeing pictures of data tables, especially if the data changes at a slow pace? The point is to stimulate insights that lead to action.
Miriam Greenberg from the Harvard Strategic Data Project spoke briefly about the practical applications that her program’s fellows have created. Skim their short project descriptions here. One success I found most interesting was about “summer melt,” when graduating seniors who have been accepted to college never actually enroll.
But the most memorable talk of the day was by David Jansen from Fresno USD, where he has been executive director of Data Science and Software Systems. In fact, it’s a presentation I’ll never forget. In a lightning fast talk, David described a highly original effort to map the social relations of middle school students, by providing them with a visual record of their own grades, attendance, extra-curricular activity and log-in history. In brief, it’s a mirror to students of engagement with school. Through this cell-phone-based app, they can connect with friends and share results. They can also compete against themselves, setting records (streaks) of continuous days of attendance, for example.
David’s a believer in building bridges. This program, which they call “Strides,” is in his words “… a platform that connects students to other students, students to teachers, and students to parents.” He’s also a believer in stimulating the intrinsic motivation in students. By providing students a record of their grades, attendance and extra-curricular activities, and then triggering encouraging notifications to students when they reach a new milestone, or conversely sending helpful observations when they are on a downward trajectory, David believes students will do the right thing.
So far, the evidence is proving David’s hunch to be correct. The application doubles as a research platform. David’s team has already discovered that students who log in to Strides at least twice a week are attending school more consistently (by about 2.3 percentage points), and also achieving higher grades (about .45 GPA higher).
This exciting experiment deserves a fuller explanation, which I’ll develop in a blog entry soon. If you can’t wait to learn more, I recommend you read this article that appeared in Wired in late November 2017.
Note, David has recently been promoted to executive officer of equity and access. Let’s hope this doesn’t draw his attention away from nurturing Strides over the months ahead.