How often have you been asked: “Tell me whether our kids in middle school achieved gains in math equivalent to the gains other middle school kids attained.”
Eric Zilbert has made it possible to answer that question (and more just like it). He’s the CDE’s go-to guy on the psychometric measurement front. In late May, he and his team released the year-to-year change scores on the CAASPP. Comparing the spring 2017 results to the spring 2016 results, for each grade level transition, provides a much-needed benchmark.
Because this is the second year his team has done this analysis, we can put two years of grade level changes against each other and compare results. If the 2017 test cycle seemed like it yielded surprisingly lower results than you’d expected, your hunch is correct. In both English/language arts and math, the year-to-year change between 2017 and 2016 was lower at every grade level transition than in the prior year (2015 to 2016).
Here are the year-to-year changes in math:
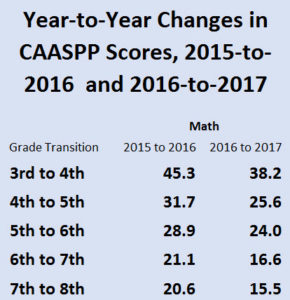
Changes in the scale scores of California students who took the CAASPP math test in 2015, 2016 and 2017
A second observation is warranted. The scale score change at each grade level transition differs, and for good reason. The value of a scale score point is not the same across grade levels. I will spare you the psychometric explanation since I don’t have a license to practice that profession. But I can tell you that both psychometricians I’ve spoken with in the course of writing this essay have affirmed that fully.
So don’t praise your early elementary instructional team for attaining twice the scale score gains as the late middle school team. Those scale score points are of unequal value.
What we’ve done to make this three year view possible is combine the results that Eric Zilbert’s team produced last year and this year. You can find his team’s work available here. Their prior year’s work analyzing the 2015 to 2016 changes are available from this link.
The results look like this:
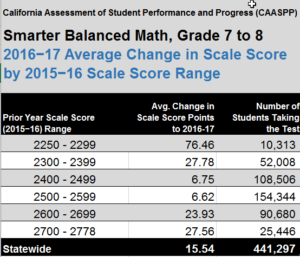
Selection from Eric Zilbert’s year-to-year change score analysis of CAASPP results in math, for students who were in grade 7 in 2015-16 and in grade 8 in 2016-17.
The scores of the prior year’s test takers appear in each row. The average change in scale score points for each row of prior test-takers then appears in the middle column. The right-most column lists the number of students in that category.
Stay tuned. His team presented subgroup level analyses of year-to-year change scores at last year’s CERA conference. More than 70 folks in that packed room leaned forward, and paid his findings serious attention. Perhaps he and his team will share similar subgroup level benchmarks at this year’s CERA conference in November.
One last note … In a January blog essay, I covered the debate about the decline in Smarter Balanced test results in nearly every state in the consortium. This odd finding, discovered by Monterey psychometrician Doug McRae, may offer additional insight into the question: “Why were this year’s (2017) gains smaller than last year’s?” On the request of California, the Smarter Balanced Consortium reviewed their item bank and returned an opinion that nothing was amiss. Other psychometricians are not convinced.