You think your 1st or 2nd or 3rd graders are learning to read. But how do you know that’s true? More to the point, how confident are you that the test evidence you’re using is sound, and how certain are you that your interpretation of that evidence is correct?
Well, if you are relying on one test alone, you are most likely measuring only one or two dimensions of reading. If you are relying upon a high quality interim assessment, designed to measure progress like the STAR Renaissance or NWEA’s Measures of Academic Progress of reading for grades 2-5, you’re mostly measuring comprehension. If you’re using any version of a student’s running record, a tally of errors a student may make when reading a passage, you’re getting something entirely different — decoding skills, pronunciation, fluency and familiarity with vocabulary.
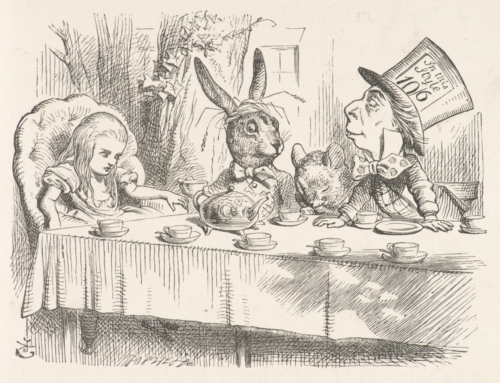
 However, if the version of the running record you’re using is provided by the publisher of your instructional materials, you’re unlikely to avoid test bias. The publisher simply has a bias in producing test results that shows that their curriculum works. So if the instructional program comes from the Balanced Literacy crowd, you’ll have a reading passage that includes pictures. Since the student was encouraged to use contextual clues when sounding out words, the use of pictures enables a student with weaker decoding skills to compensate by using the pictures to guess what the word is. That is test bias.
But if you use two test results that measure different dimensions of reading, and view those results at the same time on a scatterplot, you are able to determine when the two bodies of evidence agree, and when they disagree. This is essential evidence when teachers are deciding which students need Tier 2 support. And it is evidence that should neither be warped by publisher bias of self-interest, nor should it be deformed by errors in teacher judgment.
Our team presented our work with Morgan Hill USD (California) at the STATS conference convened by the National Center for Education Statistics in August 2022. To see and hear our presentation in full (60 minutes), click here.
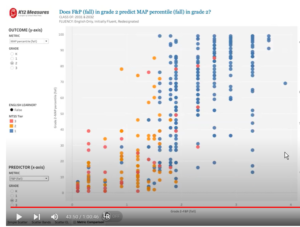
But to cut to the part that shows multiple measures in action, click here (at the 43:40 mark). Greg Smith from our K12 Measures team presents a scatterplot showing 363 second-graders’ scores on the Fountas & Pinnell running record (horizontal axis) juxtaposed against their scores on the Northwest Evaluation Association’s Measures of Academic Progress in reading fluency (K-2) (vertical axis).
The question this visualization of multiple measures is designed to answer is a triage question: are the right students being referred for Tier 2 support in reading?
But it also shows the degree to which the Fountas & Pinnell results do and don’t agree with the results from NWEA’s Measures of Academic Progress. The results may surprise you. We were also able to juxtapose other measures, including the KeyPhonics assessment of phonics fundamentals, acquired in 2022 by STAR Renaissance and renamed STAR Phonics.
Note … you can find my write-up of this evidence-building project here, in the blog section of our School Wise Press website.
Moral of this story: There’s a lot of power in multiple measures. Why not build better evidence using these visual methods?