The CDE’s Dashboard has become the new interpreter of schools’ and districts’ health. Its dials and color matrixes have replaced numbers as the measurement language of accountability. Its rules determined in December 2018 that 374 districts deserved “differentiated assistance” and the money that comes along with it (between $100,000 to $300,000 per district, depending on enrollment).
The Dashboard’s signals have created new responsibilities for staff at county offices of education, who are tasked with providing help that districts never asked for. Those who lead and govern those 374 districts have had to explain to their staff, students, parents and voters why they’re on that list of 374. This signal of apparent trouble can only make more difficult the challenge of retaining staff, persuading parents to enroll their kids, and convincing voters to approve bond measures and parcel taxes.
Then in February 2019, the CDE released a list of 784 schools they considered to be “lowest performing,” again using the Dashboard as the decision tool of choice. About $150,000 flows to each school on that list.
Given these consequences of the Dashboard’s signals, doesn’t its interpretation of the numbers deserve a second look?While the Dashboard has been criticized for its awkward design – the user interface, the pie-wedge icons that are now dials, the architecture of the site – criticism of its rules and its findings has been harder to find. Paul Warren’s research brief of June 2018, published by the Public Policy Institute of California, is the most substantial critique, in my view. Morgan Polikoff, Shira Korn and Russell McFall authored a report in September 2018, as part of the “Getting Down to Facts” project, which included a rich collection of superintendent’s critical comments. If you want a 90 second summary of Morgan Polikoff’s views, click here to watch his video interview.
Some advocacy organizations, especially Children Now, have been tough critics of the Dashboard’s method of identifying achievement and opportunity gaps. Veteran journalist Dan Walters has gone further and criticized the state’s under-investment in education info systems.

In the Hans Christian Anderson fairy tale, “The Emperor’s New Clothes,” all the people in town are encouraged by the King’s tailors to flatter the King. So they pretend to be impressed by his “new clothes,” when in fact he is wearing nothing but britches. The California way of accounting for school and district vital signs is prompting a similar agreement among education leaders to ignore its obvious flaws.
But after attending the conference circuit (CSBA, ACSA and CERA) and hearing no criticism of the Dashboard above the level of a whisper, I came to the unhappy opinion that these organizations were ready to give the Dashboard their tacit approval. There’s much harm that results when instruments are broken, or when their signals are misinterpreted. False positives (saying something’s a problem when it’s not) and false negatives (failing to flag something that’s a problem, when it is) are visible all over the physical and social sciences. In most of these fields, scientists debate the findings of research, at times focusing on the quality of the evidence, and at others focusing on the human judgment that uses evidence to form a hypothesis. Where is the evidence of that healthy debate in the K12 world?
Let me join Paul Warren and Morgan Polikoff and others, and contribute some criticism of my own, largely about the Dashboard’s measurement methods. These are not nit-picky concerns of little consequence. They are substantial concerns about logic rules that lead to errors: districts and schools flagged for the wrong reasons, and also not flagged when they should be.
Here are my first five. I’ll offer more in a later blog post.
Combining two unrelated things together (status and change)
The challenge of explaining what is meant by an abstract factor like the distance from level 3 represented by the scores of students is already difficult. Adding to that complexity by combining it with a factor of change from the prior year makes the communication barrier not lower, but higher. But even worse, it results in a measure that makes no sense, in my view. The two factors are independent entirely, and should be reported separately.
Some factors, on the other hand, need to be combined. If you are to answer the question, “Am I overweight?” you need to regard your weight and your height together. That answer is plotted on a body-mass index chart, and is usually calibrated in BMI points. But students’ test results are in no way similar
Losing information by reducing 700 scalar measures to 5 colored range-and-frequency distributions
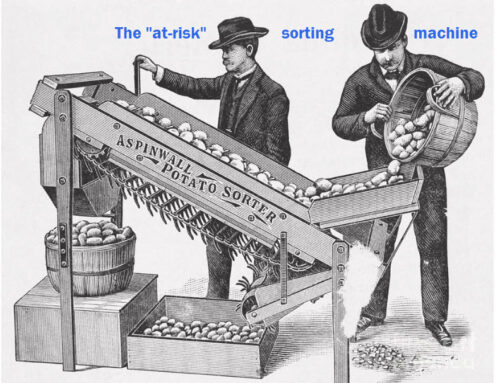
We have five colors on a grid, separated by four boundary lines. We also have numbers to express points on a 700 point scale. Rather than use the language of numbers to describe the average scale score of students who took a test, the CDE Dashboard poured all results into one of five barrels, rather into one of 700 scale scores (or narrow ranges of scale scores based on the imprecision in the results). This, combined with the focus on the magic line called “meeting standard” (or level 3), results in a big loss of information.
Disregarding imprecision of test results
Test results are always imprecise. But when a test has between 35 to 45 questions, covering between 50 to 75 standards within a field of knowledge, that imprecision is big. At the student level, imprecision is often between +/- 25 to 30 scale score points. It’s big enough to swing a student across a boundary line separating level 2 from level 3. At the school level, it is often between +/- 8 to 14 scale score points. Why doesn’t the Dashboard take that into account?
Measuring gaps by comparing the entity being measured to the whole it is compared to
This is a logic error, pure and simple. You don’t compare California’s population to that of the three western states, because California is a large part of that region. Similarly, you don’t measure an achievement gap for Latino/Hispanic students by comparing their test results with those of all students, especially when Latino/Hispanic students may comprise 40 percent of the student body as a whole. I’ve dived deeper into this error in a prior blog post.
Disregarding history when measuring change
Big gains in one year make lower gains or losses highly likely in the next year. The Dashboard creates a year-to-year change measure for every factor. Why disregard the facts of the prior three years? If you expect a person to interpret year-to-year change, that person is more likely to make a reasonable inference if they can see what’s occurred in the prior three years. That way, big changes in prior years could explain smaller gains in the current year. (Statisticians would cite the regression to the mean, but no need to summon that genie to join this discussion.)
I encourage you to stimulate discussion with your county office folks, among your cabinet, or with your board members. This is a good moment to raise your concerns. With new State Board members taking their seats, perhaps these flaws in the Dashboard can be debated at last.
Click here to see other blog posts on the topic of the Dashboard’s mismeasurement of schools’ and districts’ vital signs.