Now that I’m stuck indoors, I’m reading more, especially news stories that attempt to squeeze meaning from numbers about infection rates, projected deaths, hospital beds, respirators … Yes, it’s gruesome, but I am curious to learn how everyone is trying to make sense of the data. Most everyone is wondering: “What do the numbers mean, and what should I do about it?”
But this led me to a tough question. Can you remember a time when you and your colleagues were half as curious about the meaning of numbers intended to represent schools’ vital signs – accountability findings on the CDE Dashboard, for instance? If you’re close to the classroom, how intense was your curiosity about the meaning of students’ test results?
I don’t expect that life-and-death judgment about the meaning of infection rates should stimulate the same intensity of interest as test results or Dashboard findings. But this comparison made me stop and think. For how many people has the spark of curiosity about how to best measure the progress of learning been extinguished? In California, I fear the answer may be that the spark has gone out for many. Here are three reasons why I’m concerned.
THE CAASPP/SBAC WASN’T INTENDED TO BE USEFUL FOR GUIDING INSTRUCTION

This kitchen appliance promised to do everything. Cooks know tools are designed to do one thing best. The same is true of assessments of student learning.
When we said good-bye to the California Standards Test in 2013, we were told to expect the new and improved assessment to do far more. Like the Veg-O-Matic, the kitchen appliance sold on mail-order tv shows (“It slices! It dices!”), the policy big-wigs sold the CAASPP as the answer to everyone’s desires. At the top of the list was the promise to help teachers make sense of each of their students’ progress. No mistake, that’s one reason why the test in California was dubbed the California Assessment of Student Performance and Progress.
Did anyone stop to wonder how a test given once in the year, that presented just 55-65 questions to students in grades 3 to 8 and 11 could do all that? Educators imagined being able to draw conclusions about their students’ grasp of ELA and math, and do so with confidence. Since the test’s first deployment in 2015, I’ve neither seen nor heard a single account of this occurring. The secret is that the CAASPP/SBAC was never designed to do that. So when it failed to deliver the benefits to classroom teachers that it was never designed to deliver, disappointment displaced hope.
THE DASHBOARD’S MISTAKEN LOGIC
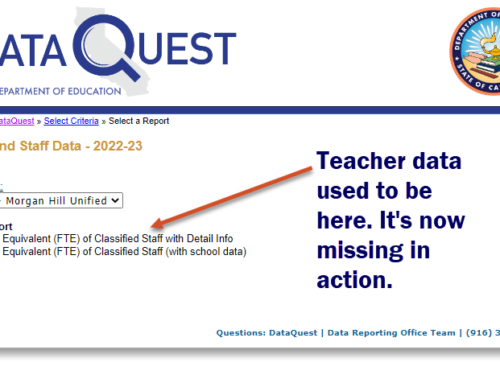
The opacity of the Dashboard has been criticized by many. These are mainly criticisms of design and complexity. But a few of us have also criticized it for its bad arithmetic and flawed logic. Paul Warren and Morgan Polikoff have written about this, with letters and reports aimed at policy-makers. I’ve written a half-dozen blog posts about this, as well, and believe that the Dashboard’s logic and math problems often result in the wrong districts and schools being flagged for “assistance.”
This has contributed to the growth of the CORE Data Collaborative, where 125+ districts have turned for better evidence of how their schools are doing. Those districts account for about one-third of California’s six million enrollment. Other districts have turned to our K12 Measures team and our bases of comparative evidence for help for similar reasons. I can’t help but think that other district leaders are demoralized, and some are perhaps now disinterested altogether in the CDE’s attempts to bring to the public’s eye reasonable measures of school and district effectiveness.
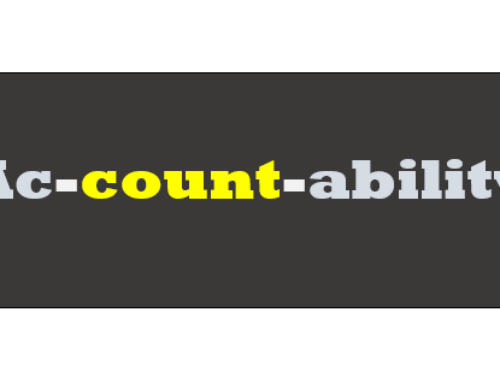
HAS CHANTING THE MANTRA OF “DATA-DRIVEN DECISION-MAKING” DULLED OUR WITS?
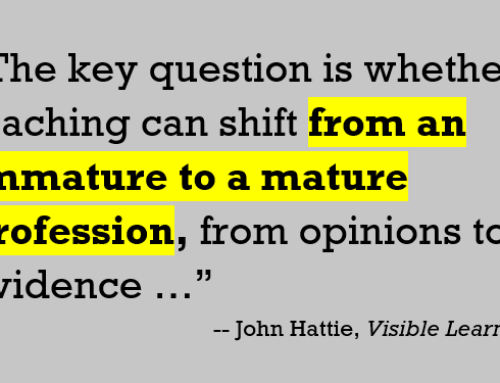
It’s been more than two decades since a small crowd of quants started to counter the “experience knows best” crew with a different idea: use evidence to make decisions. Over all that time, in most professions you’d expect to see a debate mature. But in education, where is there evidence of a debate about evidence-based decision-making?
If you find any sign of it, please let me know. I have searched all over, and only found exhortations to use data for this and that. As if using data alone were the answer! Even the phrase itself, “data-driven decision-making,” hoisted like a flag to rally its troops, is anemic. Data never drove anything. Passion for learning might drive some. Passion for student success might drive others. But data?
The mantra also never evolved. In the world of education researchers, I have witnessed several examples of a debate between traditionalists and analysts that failed to gain traction. The most recent of these is a strangely comical critique by Heather C. Hill of the work of scholars like Ellen Mandinach and Edith Gummer who have taken seriously the study of why analytic methods are not taught in schools of education. Hill’s article in the February 7, 2020, issue of Education Week, is titled: “Does Studying Student Data Really Raise Test Scores?” The reason I laughed when I read this essay is that it is a classic straw-man argument. No one has claimed that studying student data raises test scores. But the reason I cried is that Heather Hill missed an opportunity to advance the cause of intelligent dialogue. The debate about the place of empirical studies and evidence in education policy-making should be more grown-up by now. Federal law known as ESSA uses the word “evidence” 143 times. It’s required by states when they submit their accountability workbooks. If federal policy people take evidence seriously, shouldn’t this at least be a catalyst for debate?
SPARKING ANALYTIC CURIOSITY AMONG DISTRICT LEADERS
I think we need to spark analytic curiosity among district leaders. It just requires demonstrating the benefits of putting the power of analytical methods to work on problems of practice. There are clusters of analysts doing this work. Some have grouped around Sean Reardon and his Stanford Education Data Archive. (View a two-minute video on their Education Opportunity Project.) The Harvard Strategic Data Project has applied their talents to solving big riddles, and built a program to develop expertise in evidence-centered analytic methods. (Read about their many success stories, and learn about their fellowship program and summer institute.) The CORE Data Collaborative has won many new districts and county offices to its independent way of gauging school and district progress. And our K12 Measures team has developed visual tools, and built workshops to boost the measurement savvy of district and school planning teams.
If you’ve got success stories to share, I want to hear about them. Send them my way, and I’ll write them up, adding them to the gallery of profiles of California analysts’ good works.