You are looking at a map of the reading gap. These red and blue counties estimate elementary students’ reading skills. Why is weaker reading so prevalent in some states, and stronger reading in others? Why does weaker reading (red) dominate in California, Arizona and New Mexico? Why is Indiana solidly blue (stronger reading)? Why is Texas a mix of red and blue?
This picture of the reading gap is based on ten years of results of 3rd to 8th graders on state assessments. It’s been analyzed by the exceptional team at Stanford’s Education Opportunity Project, led by Sean Reardon. But the variance in scores, county by county, has been mapped by another remarkable group led by Jeremy Ney at the American Inequality project in New York City.
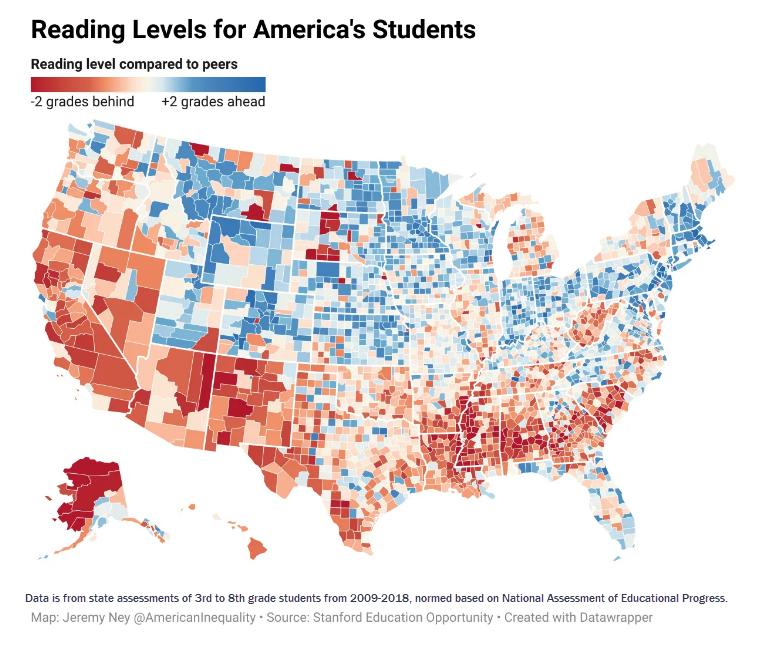
First, consider what you’re seeing – the variation in students’ scores on their states’ English language arts assessments from 2009 through 2018. Jeremy’s team calls this “reading levels,” which is a bit of a stretch, since ELA covers much more than reading. But let’s call it a fair proxy for reading.
Second, consider the metric used. The Stanford team has normed test results of each state’s assessment by a common denominator: the NAEP results. Then they took those results and expressed them in terms of a measure everyone could understand: a grade level. In brief, the Stanford folks took the average results in each year and considered it to be grade level. This is a far cry from the criterion referencing of “meeting standard” that we are all now accustomed to using. But it is a fair way to compare results across counties or districts. If you’d like to read more about the method used by the Stanford, click here for their description.
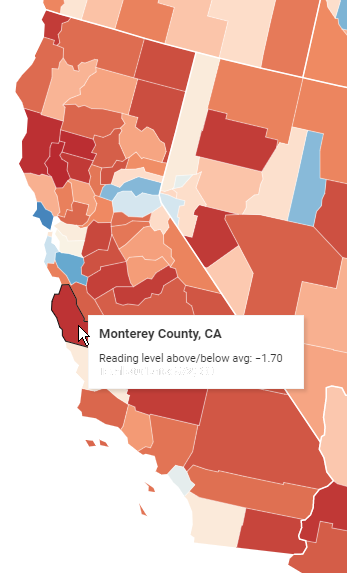
Click here to see an interactive version of this map. Results are mapped at the county level.
Look and think about state-by-state comparisons
Third, let’s look at the patterns of colors, state by state. Do state policies, practices and teacher prep programs have a visible effect? Well, compare two adjacent states and notice whether shades of blue (above grade level) or red (below grade level) dominate:
- Utah and Arizona: Most of Utah’s counties are blue, while none of Arizona’s counties are blue;
- Colorado and New Mexico: Colorado’s counties are predominantly blue, while all only two New Mexico counties are blue;
- Florida panhandle and Alabama: Florida’s western panhandle counties are blue with two exceptions, while none of Alabama’s counties abutting Florida’s counties are blue.
While we don’t know what exactly causes the differences in results across these state lines, we do know that whatever those factors might be, they have something to do with state specific attributes. Jeremy’s team asserts that it’s correlated to the household income and ethnicity of students and their families. But they don’t believe that’s a sufficient explanation.
Look at California
Fourth, California is a state where students are reading below grade level, with two clusters of exceptions. The not-golden state appears in various shades of red. The blue exceptions appear in the vicinity of Lake Tahoe (El Dorado and Placer counties) and the Bay Area (Santa Clara, San Mateo and Marin counties). A handful of counties appear to be about on grade level: San Diego, Orange, San Luis Obispo, Alameda and Contra Costa counties.
Because I’ve been a Californian most of my life, and because our K12 Measures team has worked only with California districts, I’ll offer a few observations. California is one of 11 states not requiring its districts to screen for dyslexia. This could explain some of the redness. California’s fourth-grade students were ranked 41st on the 2019 NAEP reading test. This confirms that California lags now, not just on average over the prior ten years.
The California Department of Education (CDE) has no official view of the right or wrong ways to teach reading. Unguided districts go their own ways, and most have selected Balanced Literacy curricula. (This is just my hunch, based on a 2019 market share study by Education Week, and this survey of the largest 331 districts conducted by the California Reading Coalition (CRC) in 2022 and updated in 2023. The CDE does not track the curricular choices made by districts. So I can only guess.)
The report card created by the CRC looks at 3rd grade students who are both qualified for meal subsidies, and whose ethnicity is Latino/Hispanic. The districts which have taught these students least effectively include many in the prosperity zone of the SF Bay Area. Those with greatest success are in the less prosperous valley counties.
County Offices of Education Should Lead
These are rich clues to why California lags so far behind the rest of the country in the teaching of reading. But Californians deserve more than clues. If the state education agency is going to sit on its hands, county offices should stand up and start running toward success markers other states have already adopted. Almost all county superintendents are elected officials. They are responsible to voters. Rather than follow state officials passively, county office leaders could:
- Champion the right ways to teach reading, most of which are Structured Literacy methods;
- Criticize the wrong ways to teach reading, most of which fly the flag of Balanced Literacy;
- Advocate for universal dyslexia screening;
- Take a census of districts, asking them whether they screen for dyslexia and how they teach reading;
- Stop approving LCAPs automatically, but instead evaluate them for quality of evidence, clarity and reasonable identification of strengths and weaknesses;
- Champion high quality assessments of reading in grades K-5, and contribute to the staff development that makes smart use of good assessments more likely.
Let’s see if some independent minded leaders of county offices are inspired to push the edge of the possible.

