Planning doesn’t excite many K-12 leaders. But in the south end of Santa Clara County sits Glen Webb, who is CIA director (curriculum, instruction and assessment) for Morgan Hill USD. He gets excited by planning, and his years as a science teacher equipped him to plan like a scientist. This year, his plan won kudos from the Santa Clara county office, and then won an award from the California School Boards Association (CSBA). His story holds lessons for everyone who writes, reviews or approves Local Control Accountability Plans (LCAPs).
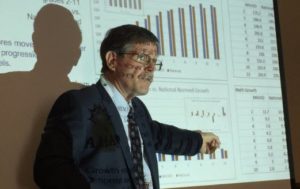
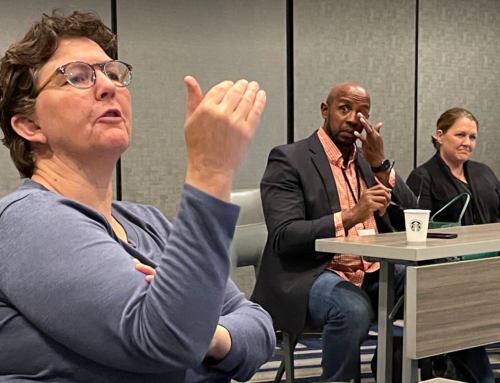
Glen Webb at CERA conference delivering a talk on the topic of how to interpret conflicting evidence. (November 20, 2019)
Morgan Hill’s leadership, from the board to Supt. Steve Betando to Glen’s new boss, Pilar Vazquez-Vialva, take planning seriously, too. Taking planning seriously, and their high regard for quality evidence, led them to give Glen what he needed to build a plan that steers the right resources to the right students, for reasons that are clear and crisply stated.
Glen has written Morgan Hill’s LCAP for three years in a row. And this past year, his plan was reviewed by Liz Wolfe, the newly arrived LCAP Queen of Santa Clara CoE. She takes planning seriously, of course. So when she reviewed Glen’s work in late spring 2019, she got excited, too.
“[It] is unlike anything that I have seen throughout Santa Clara and San Mateo Counties. It is unparalleled in its level of budget transparency. It is easy to read and accessible to stakeholders. It provides links to more information … [and contains] a comprehensive assortment of metrics. It is exemplary in depth of analysis…. It is a leading example of thorough, thoughtful planning and reporting to the school community.” — Liz Wolfe, Director of Differentiated Assistance & District Support, Santa Clara CoE
Liz Wolfe ought to know an exemplary plan when she sees one. She was responsible for LCAP reviews at San Mateo CoE for years, and then switched teams early in 2019, taking a similar position in Santa Clara CoE’s offices.
If you want to see for yourself what a great plan looks like, here’s a link that will take you there.
Liz Wolfe wasn’t the only one who considered Glen’s plan worthy of praise. On December 5, CSBA awarded Morgan Hill its coveted Golden Bell Award for their LCAP.
Evidence more solid than the Dashboard’s findings
I have reasons of my own for considering this plan to be a worthy award winner. (But before I do, a moment of candor is warranted. I led the team that provided analytic support to Glen and Morgan Hill’s leadership for the past three years.) In brief, Glen and his team carefully selected evidence of the highest quality, and they used that evidence properly. Most important, the plan relies very little on the Dashboard as an evidence base because Morgan Hill has evidence of higher quality in its hands, and knows how to use it. Here are five examples:
- The plan relies on Fountas & Pinella for measures of developing literacy for elementary students in grades 1, 2 and 3.
- The plan turns toward NWEA MAP assessments and Lexile Reading for measures of literacy in higher grade levels.
- For measures of math and science mastery, the plan relies on NWEA MAP assessments.
- For measuring college readiness, the plan gathers relevant evidence starting with PSAT results in grades 8 and 10. Plus the plan reveals participation rates for the SAT and ACT. And graduates’ achievements are detailed: those meeting A-to-G requirements, attaining Seals of Biliteracy and attaining Golden State Seal of Merit awards.
- For measuring career readiness, the plan details the number of students in each career pathway, comparing prior year to current.
Sound comparative methods
That’s not all. Glen’s methods enable him to make sense of the numbers. Descriptive statistics alone would leave any plan with no answer to the question: “How are we doing?” But Glen has used comparative methods of two types. First, he’s compared Morgan Hill to four districts in Santa Clara County whose students most closely resemble Morgan Hill’s students. Second, he compares Morgan Hill’s current year to one or two prior years’ results. That’s what makes fullest sense of the data in hand.
Finally, at the very start of Goal 1 in the Morgan Hill LCAP, Glen puts staffing and financial data. The reader of this LCAP will learn how many interns, first-year teachers and teachers on waivers are working. Compensation comparisons to four benchmark districts in the county are visible. Raises are stated. Those districts whose voters have passed parcel taxes are noted. (Morgan Hill has not done so, and that’s visible, too.)
There’s more to applaud here. I’ll do so in a follow-up blog post, and there I’ll focus on Glen’s analysis of curricular strengths and weaknesses.
Great plans are a challenge to all
In conclusion, Morgan Hill’s LCAP is a challenge to every district LCAP team. You can do more than fill in the blanks. You can (and should) show both what you think and how you think about your district’s students, teachers and financial resources.
There’s a lesson here, too, for county offices of education. If Santa Clara CoE can support a suburban-rural district of 8,600 students in planning with better evidence in hand than the CDE Dashboard, why can’t you? The Dashboard’s flaws have led 125 districts to turn to the CORE Data Collaborative for better evidence. Other districts have turned to our group, the K12 Measures Team of School Wise Press, for the same reason. If your CoE is going to help your districts build smarter LCAPs, isn’t it time to help them do what Glen Webb and his Morgan Hill team have done?