I am weary from reading predictions of pandemic-related learning loss. They all share two assumptions I question: (1) that missing days of school must mean losing knowledge and skills, and (2) that when students eventually take interim assessments in the fall, they will all show declines relative to their prior score.
Many of those asserting this learning loss cite no evidence at all. Others cited the blog post published by the Brookings Institute on their Brown Center Chalkboard, titled “The impact of COVID-19 on student achievement and what it may mean for educators.” That study, led by Megan Kuhfeld, Jim Soland and a group of NWEA and University of Virginia researchers, used an analysis of many years of NWEA’s MAP results, analyzing the slope of decline from spring assessments to the next fall assessment. They then applied that slope in a straight line, assuming that the loss captured from spring to the following fall would be highly similar if the starting point were moved back to mid-March. Their key assumption, clearly stated in their working paper as a projection, would then result in an even greater loss of skills and knowledge.
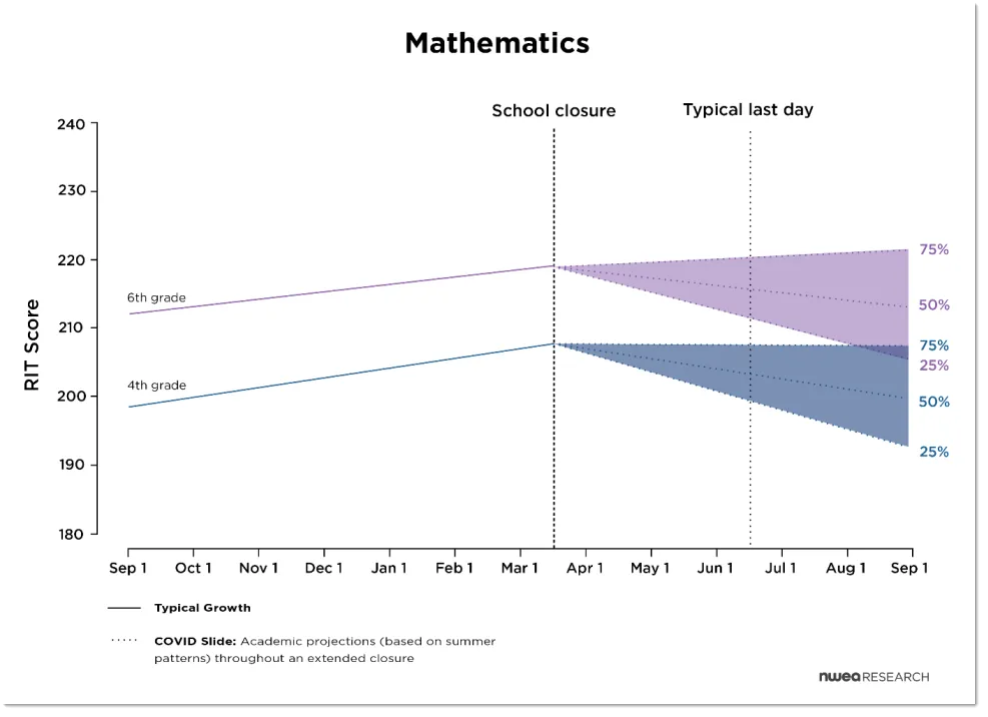
This represents a forecast of projected COVID-19 related learning loss in math for 4th and 6th graders. Top of the range projects results for students at the 75th percentile, and at the bottom of the range for those at the 25th percentile. Credit: NWEA.
If you read their short blog post, or if you’re brave enough to tackle their 57-page working paper, you’ll see they’ve acknowledged the crude nature of their forecast. It is a finger in the wind, a guesstimate, and one which is fair to offer. It is based on more than summer learning loss studies (Hurricane Katrina, for example). But it is not the result of measured outcomes. It is a forecast. And the meat of their working paper offers a more important set of observations about the different level of projected “loss” of math and reading. In addition, it projects the degree to which the top quartile and the bottom quartile of students might show very different rates of learning “loss” in both subjects. Then the authors provide smart recommendations that educators could put to use pronto.
How do you know students have lost knowledge or skills?
The notion of losing something troubles me. Why don’t we consider this a slowing down of the pace of learning, like a slower rhythm of a piece of music. If we’re dancing, we don’t “lose” a beat when the music slows. We slow down and keep in rhythm to the music. If we have been working on a fall-away jump shot, if we don’t practice it for six months, we’re going to be rusty. But how quickly might our prior skill level return once we’re on the courts again?
The notion of a “loss” of learning comes from a too literal an interpretation of test scores. If students take a spring interim assessment, and then a fall assessment 100-120 days later, we have come to expect the fall score to be lower than the spring score. And we have a quick reason on the tips of our tongues to explain it: “summer learning loss.” Better evidence would result from five or six testing events over two or three years’ time. The more test events, the better the evidence.
But what if the mastery of skills has remained more or less constant, and it is students’ abilities to recall correct answers that are muted. What if their level of mental acuity in the spring, after 160 days of school have left them with quicker recall, and intellectual muscles better exercised? If their test scores in the fall are really lower, could this reflect more on these seasonal circumstances and far less on their mastery of knowledge and skills?
Imprecision of student scores needs to be visible
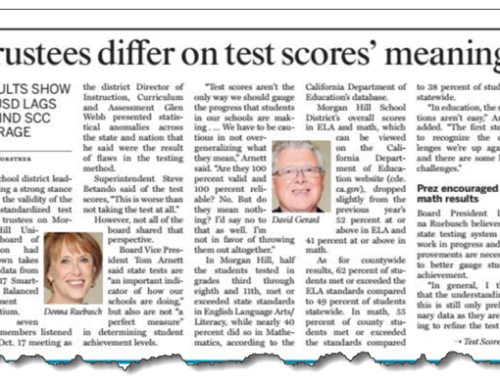
The variation in scale score results that psychometricians expect to see is often missing from administrator and teacher level reports. Our California CAASPP/SBAC reports no longer include standard error in the parent report. But in 2015 and 2016, it was visible as stems and whiskers above and below the big dot that represented a student’s score. But now they’re gone, and visible only to those assessment leads who use TOMS and bother to look at the small type. I suspect CDE or SBAC folks presumed that parents and educators weren’t capable of handling the complexity of uncertainty. Sparing them the facts of inescapable imprecision was seen by the CDE or SBAC higher-ups as a gift to the peasants outside the castle of K-12. I see it as condescension, and as a violation of the APA’s Standards for Educational and Psychological Testing (Standard 6.10, 12.11 and 12.12).
The degree of imprecision of student-level scores on the CAASPP/SBAC is substantial. It’s common to see (+/-) 25 to 35 scale score point variation in individual results – enough to cause many a student to straddle a boundary separating Level 2 from Level 3. With interim assessments like NWEA’s, imprecision is less of a factor, but at the student level, still sizeable enough to render ambiguous the determination of whether a student’s fall score was higher or lower than her score the prior spring.
So how likely is it for a student to have a lower score on their current test compared to their prior test? Even with tests given annually, it’s common. Psychometrician Howard Herl, who is a friend and colleague in our K12 Measures work, was on a team at the Los Angeles CoE during the era of the California Standards Test. When helping principals interpret students’ test results as part of an II/USP county office assistance team, he often saw one-fourth of students’ scores move up a proficiency band, one-fourth move down, and half remain the same. When Howard and I examined NWEA results, winter-to-winter, on behalf of a client, we saw a similar proportion of students’ scale scores decline. That’s over a full year’s time, avoiding the precarious measurement moment of the fall interim assessment.
Precautions and predictions
I urge you to look at the variation of student results when your district administers the next interim assessment. Compare current to prior scale score results for all your students, and look to see what proportion scored higher after months of absence from school.
In fact, I suggest you make bets with your colleagues and co-workers. If the prevailing opinion of COVID-learning-loss is universal, and your colleagues bet that all students’ scale scores will decline, then ask them for 5-to-1 odds that at least 10 percent of students will actually show gains. I think you could make enough spare change to enjoy a nice meal out (if restaurants are open by then).
If that occurs, as I suspect it will, what will that mean to your fellow educators? How will you explain that some students learned a lot while not coming to school? When you see which students showed gains, you may discover patterns that help you answer that question. Don’t be too sure of what causes some kids to score higher. But be a detective. Gather evidence before you form a hunch.
You may be wondering when interim assessments are going to be given. But if your district is an NWEA client, be aware that they have developed a remote administration version. This NWEA press release explains the particulars and provides a link to their technical bulletins. If curriculum can be delivered from afar, certainly tests can be delivered that way, too. The jury’s still out on the soundness of the results, but NWEA and its research teams are known to be smart and careful. With 400,000 tests given this way as of mid-July, they’re no doubt learning a lot and fine-tuning this as they go.