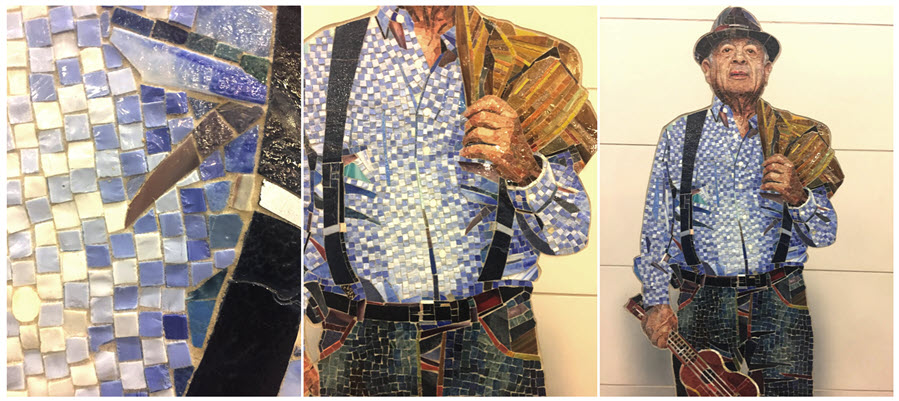
 If analysis is what you’re doing, you face some of the same decisions as when you view a work of art. How close to a painting should you stand? If you’re looking at a sculpture, from what vantage points should you look? If you stand too close, what you see may form a pattern. The pattern may look pleasing. It may resemble something. But you won’t be able to make sense of it. What’s missing is the context the artist created. You’re not able to make sense of the part because you can’t see the whole to which it belongs. But if you stand too far away, you miss the details. At times, those details are essential to make sense of the picture. Graphic designers often display maps that show detail over a small area as an inset within a less detailed map of the larger geography. They do this to provide the reader with context.
Even attendance requires context
Looking at education data requires the same attention to context if you’re going to make a good guess as to what it means. (In the language of stat-geeks, “good guess” should be replaced by “valid inference.”) Consider the power of context when interpreting something simple: attendance rates. In 2018 and 2019, the meaning of attending an elementary school was rather simple: was a student present at the start of the day when attendance was taken.
In March 2020, you could certainly do the same thing. But you would need to know that COVID-19 illnesses affected absences during the month, and finally led to school closures. So the meaning you make of attendance in the 2019-20 school year would have to take the pandemic into consideration. You’d need distance from counting butts in seats in order to make proper sense of it all. And you’d need attention to detail to estimate the online equivalence of attendance after school closures.
Discipline requires context to be meaningful
Now consider the power of context when interpreting discipline data. It’s a complicated interaction among students, and between students and teachers, within a context of district policy, school policy and teacher tolerance. In middle schools, where discipline events soar in every district I’ve examined, these three contexts are especially necessary in order to interpret the meaning of suspension events. Let’s note the even larger context of community values and social trends. Remember the era of “zero tolerance.” That unhappy era led to the triumph of strictness. Rules prevailed. Punishing principals were praised. If you were analyzing discipline over the ten years from 2010 to 2019, you’d need to assign the “zero tolerance” era a lot of blame for the rise in suspensions all over the U.S.
To equate suspension rates too quickly to any one factor is a fools’ errand. In a middle school, is a high suspension rate due to female teachers’ dislike of boys? Is it teacher bias? Is race bias or religious bias among the kids being given a carte blanche? Are the kids running wild because the adults are not really in charge? Are bullies being given a free pass by staff who are afraid to intervene? Is there a gang rivalry at work? Are students acting up because they’re angry about being unable to read their textbooks?
Recommendations: stand back for the big picture, then get up close for the human stories
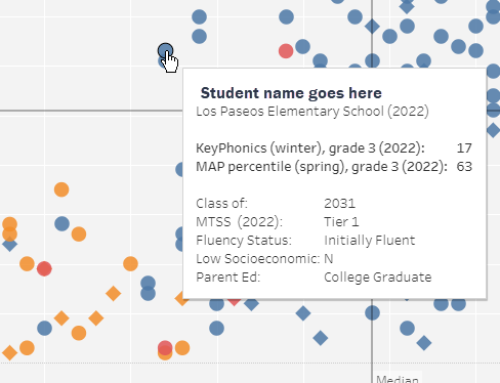
How close you get to each suspension event gives you an opportunity to understand its human particulars. That can help build the events into a credible body of evidence that leads to sound conclusions about the causes. But you’d also need to stand back and look at the data over at least several years’ time. You’d be wiser still to look at suspension events in a few schools with highly similar students in different districts to compare and contrast. It takes both proximity and distance, and it takes analytic and synthetic thinking, to build a credible hunch about the size of the trend, its meaning, and its probable causes. Here are my recommendations …
- Build evidence you can query at a distance, as well as evidence you can query up close.
- Stand back, then get up close to individual student records, then stand back again.
- When exploring for root causes, don’t rush to judgment.
- Watch out for literal minds and dogmatic ideas.
- Value equally taking things apart (analysis) and putting things together (synthesis).
- Build a small analytic team of even two or three people who think differently and enjoy exploring riddles.
- Match the right tools to the right job. One tool for detailed analysis and another for larger scale pattern recognition. One tool for mathematical inquiry and another for visual inquiry.